

Understanding what's currently happening in the market is crucial to make informed decisions. The concept of market regimes helps us gain insight into this. In broad terms, the market can be bullish, bearish, or range-bound. Professionals identify over ten different regimes.
In this article, we'll explore how you can determine market regimes using standard deviation of prices. It allows us to assess how values in a dataset are distributed around the mean.
In our dataset, we have 260,000 rows of data representing tick-by-tick price changes of ETH/USD over approximately 3 days collected via websockets.
df = pd.read_csv(filename, names=['receive_timestamp', 'price']) df['receive_timestamp'] = pd.to_datetime(df['receive_timestamp']) df.set_index('receive_timestamp', inplace=True)
First, we need to convert price changes into a logarithmic form, meaning we'll analyze percentage changes instead of regular prices. This helps smooth out volatility and enables easy comparisons across different periods.
df['price'] = df['price'].apply(np.log)
Now, let's calculate the standard deviation of logarithmic prices.
df['std_dev'] = df['price'].rolling(window=100).std() df['std_dev_ma'] = df['std_dev'].rolling(3000).mean()
Next, we'll define several levels and calculate the boundaries for these levels. Level 0 will correspond to the lowest volatility, with each subsequent group representing higher volatility.
std_dev_ma_threshold_1 = df['std_dev_ma'].quantile(0.2) std_dev_ma_threshold_2 = df['std_dev_ma'].quantile(0.4) std_dev_ma_threshold_3 = df['std_dev_ma'].quantile(0.6)
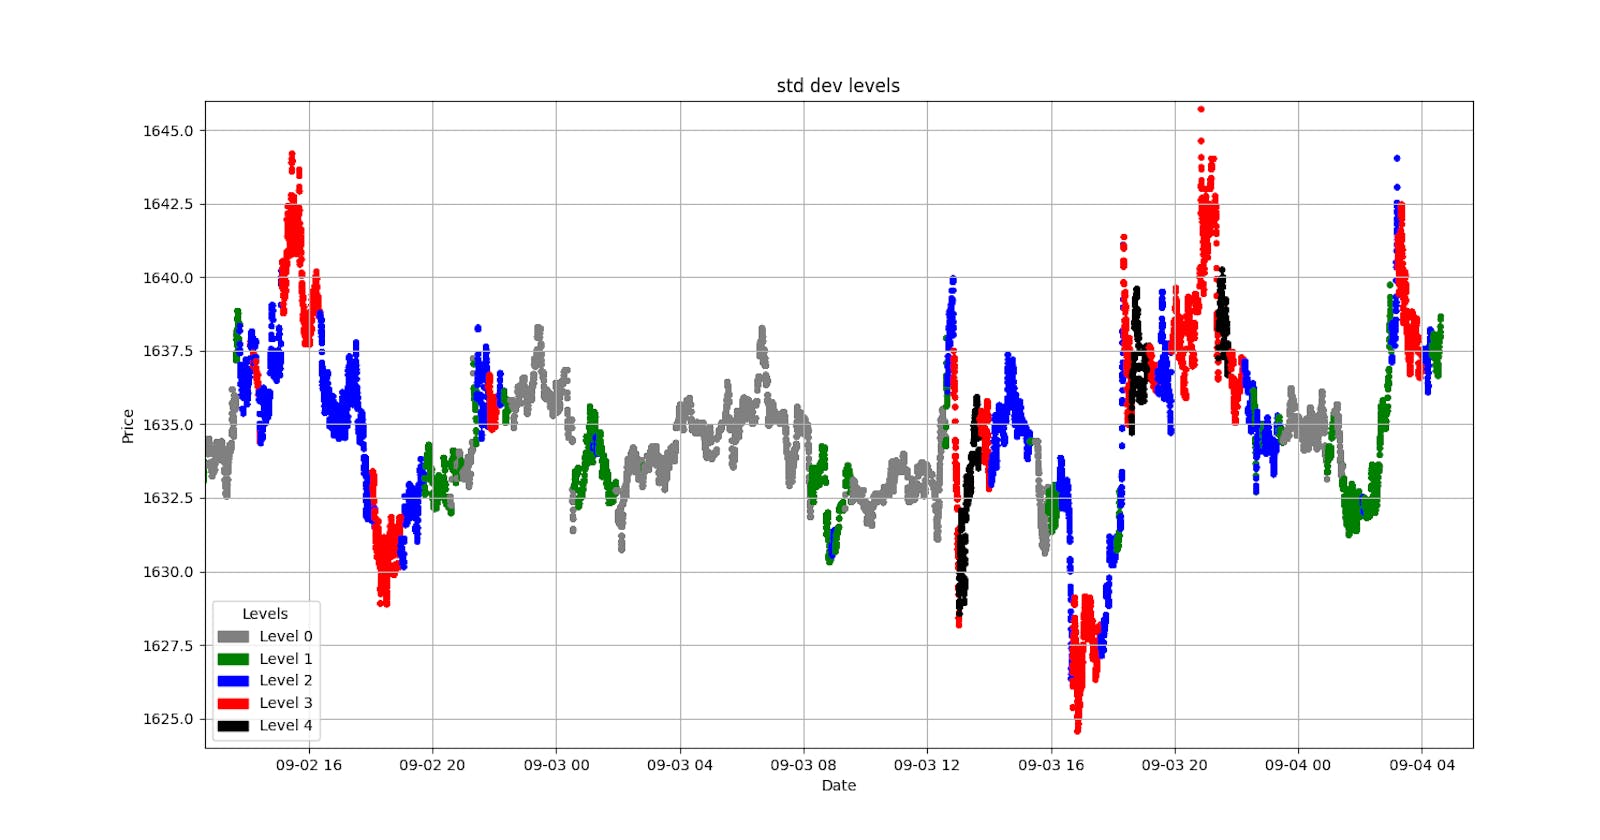
Now, we can create a price chart and mark our levels.
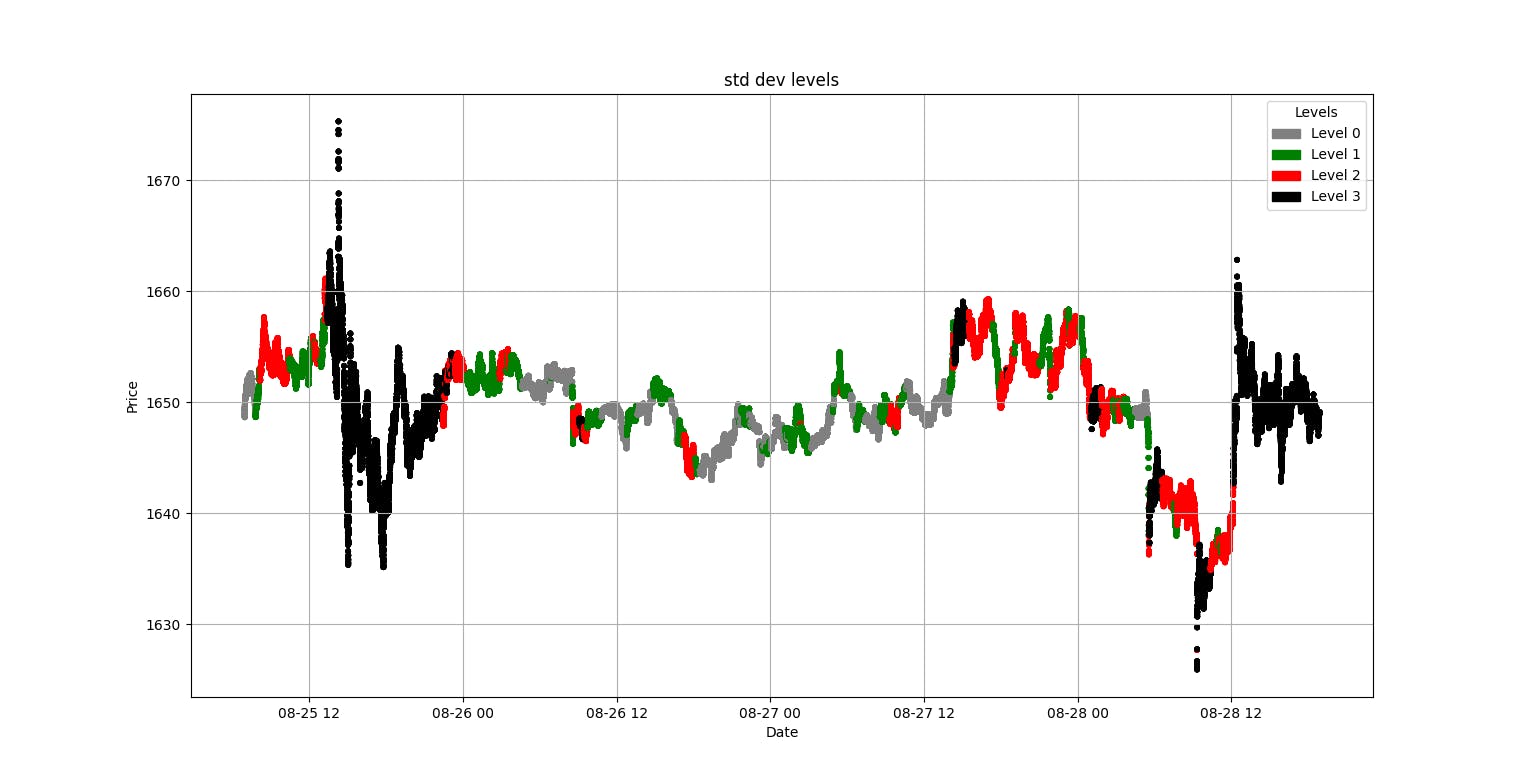
Gray and green zones represent low volatility, while red and black indicate the most volatile segments.
Let's take a closer look at the high-volatility segment.

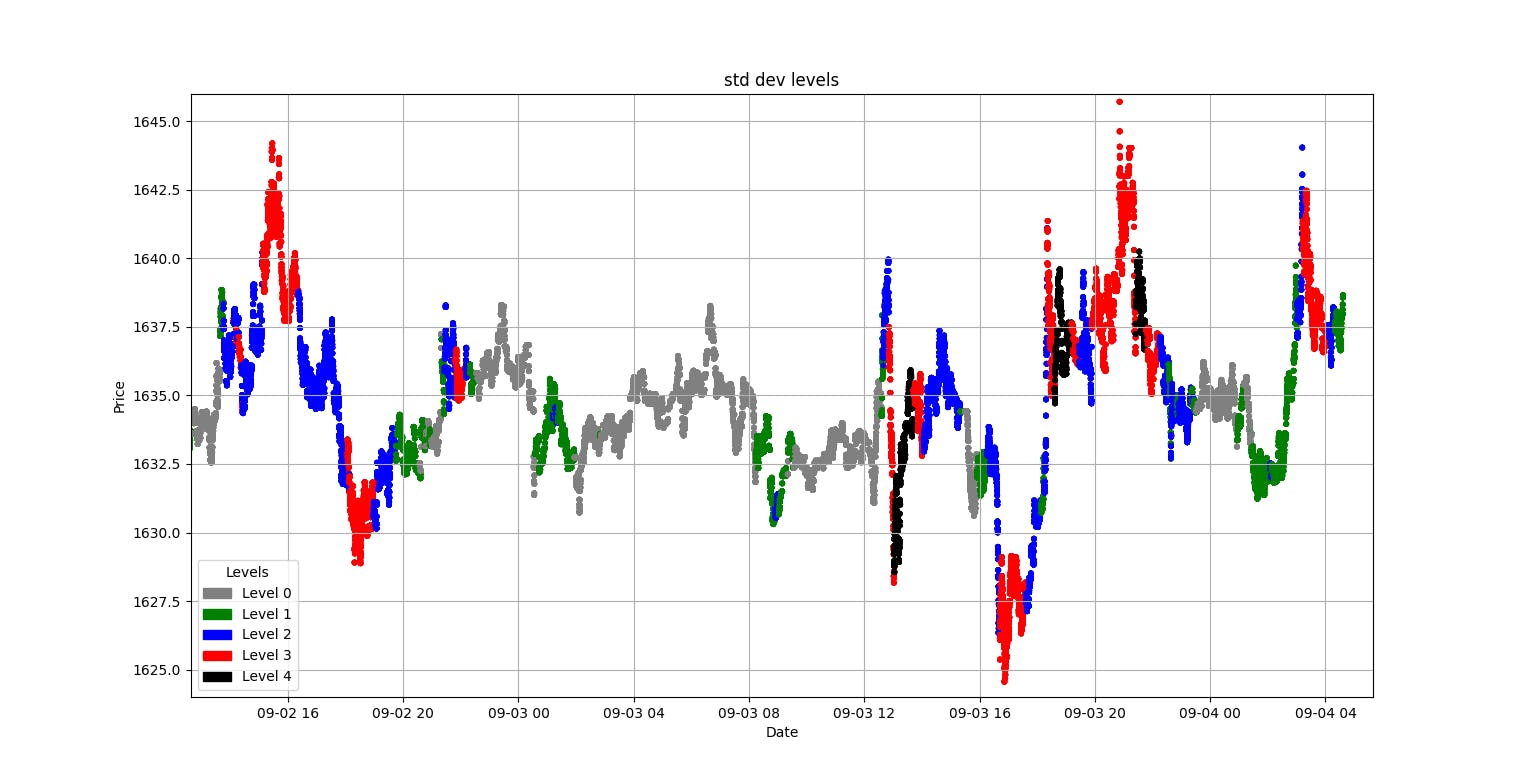
The faster the price changes, the higher the volatility and standard deviation.
Now, let's examine a chart with a higher resolution.
These findings can be interpreted in various ways. You can enable or disable your trading strategies based on the market's volatility level. I plan to use this data to determine the distance from the mean price at which I'll place my orders as a market maker.
Repository - Link
Twitter - Link