

Abstract
Our trading software is definitely going to consume some market data. The most straightforward way to use market data is by analyzing the market and producing some sort of signals for our trading system. But we can also gather a vast amount of data to further build analytical models, train ML algorithms, prepare reports, and more.
Market data is often gathered from data providers, exchanges, and other sources. We will learn how to generate synthetic market data. Later we will receive data from external providers, and we will build a data storage system ourselves for educational purposes.
What is market data
Market data means prices in general. It consists of facts about an occurred trade: name of exchange, name of the asset, price, quantity, trade timestamp, and more. Now we will talk about the two most common types of market data: ohlcv and ticks.
OHLCV
First of all, some definitions. OHLCV is market data combined into a block, it’s not really precise, but it gives traders a general understanding of what happened in the market.
OHLCV corresponds to Open, High, Low, Close, Volume – this is information about trades closed during a period of time(e.g., 1 minute, 15 minutes, 1 hour, 1 day, etc.).
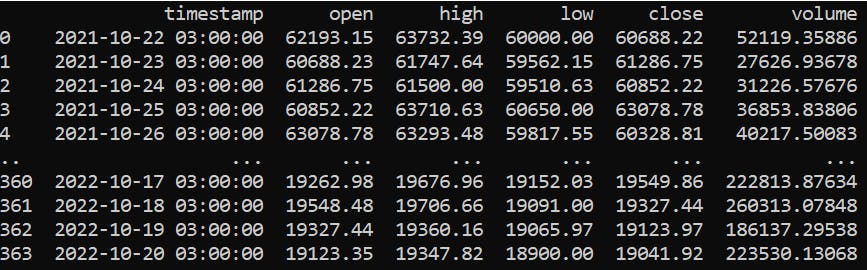
For example, let us say we talk about BTC/USDT market; OHLCV data was gathered for one day period. During such a period, thousands of trades can be processed on large exchanges like Binance. OHLCV gives us only general information: first trade was at a price 19123$(O), the highest price during this period was 19347$(H), the lowest price was 18900$(L), the last price was 19041$(C ), and the sum of all trades during the period was 223500(V).
And, of course, our data is marked with timestamps so we can easily understand when those trades were executed. In our example, data was gathered from October 22, 2021, to October 20, 2022.
Ticks
Tick data is information about each separate trade that happened in an exchange. Those who need more details about the market prefer tick data.
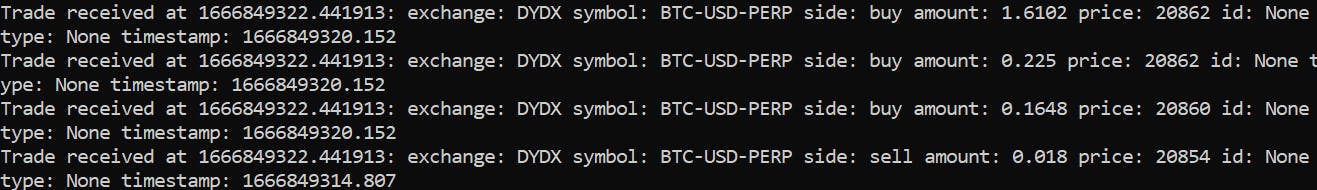
In this example, we connected to DYDX decentralized exchange via WebSocket. Our tick data consists of a timestamp of each trade, symbol(e.g., BTC/USD), side(BUY or SELL) and amount(in BTC).
Synthetic data
As our goal is to understand the pros and cons of different data consumption, storage, and manipulation approaches, we will need a lot of data. We will use synthetic data generation as it’s pretty easy to generate 10 or 10 million data samples with the same function.
First of all, let’s define some basic data classes to work with.
class OHLCV:
    def __init__(self, timestamp, open, high, low, close, volume):
        self.timestamp = timestamp
        self.open = open
        self.high = high
        self.low = low
        self.close = close
        self.volume = volume
class Tick:
    def __init__(self, timestamp, symbol, side, amount, price, exchange):
        self.timestamp = timestamp
        self.symbol = symbol
        self.side = side
        self.amount = amount
        self.price = price
        self.exchange = exchange
Now we will create one more class, DataSample. It will be used to generate synthetic data. We will implement 3 methods for now:
- generate() to generate a single data sample
- build() to generate datasets using generate function
- plot() to visualize our data
class DataSample:
    def __init__(self):
        pass

    def generate(self):
        '''generates 1 data sample'''
        pass

    def build(self):
        '''builds a dataframe of data samples'''
        pass

    def plot(self):
        '''visualizes our dataset'''
        pass
Now we will build 2 more classes – DataSampleOHLCV and DataSampleTicks. They both will have implemented methods generate, build and plot.
Generate function will use Random library so our prices will look more natural. Each next generated price will be slightly different from the previos one.
DataSampleOHLCV and DataSampleTicks code is available in my GitHub repo.
And, finally, one more thing – DataGenerator. It will utilize both DataSampleOHLCV and DataSampleTicks classes and will work as a single interface to generate synthetic data.
class DataGenerator:
def __init__(self):
self.ticks = DataSampleTicks()
self.ohlcv = DataSampleOHLCV()
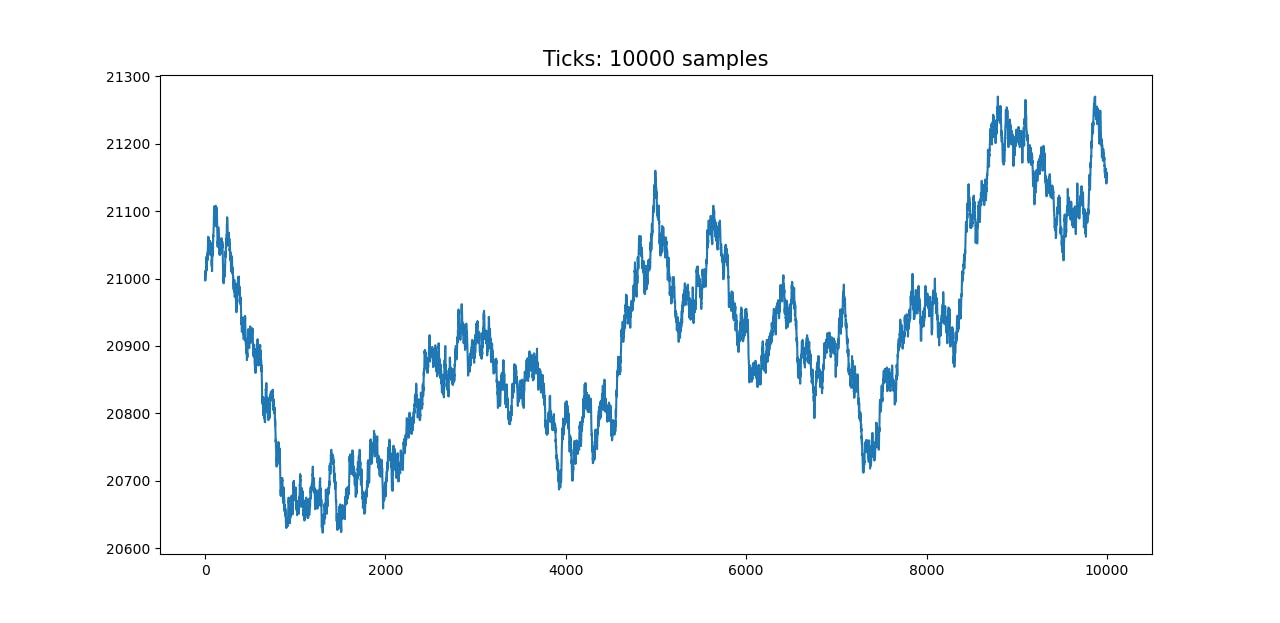
def run_ticks(self):
data = self.ticks.build(n = 10000)
self.ticks.plot(data)
return data
def run_ohlcv(self):
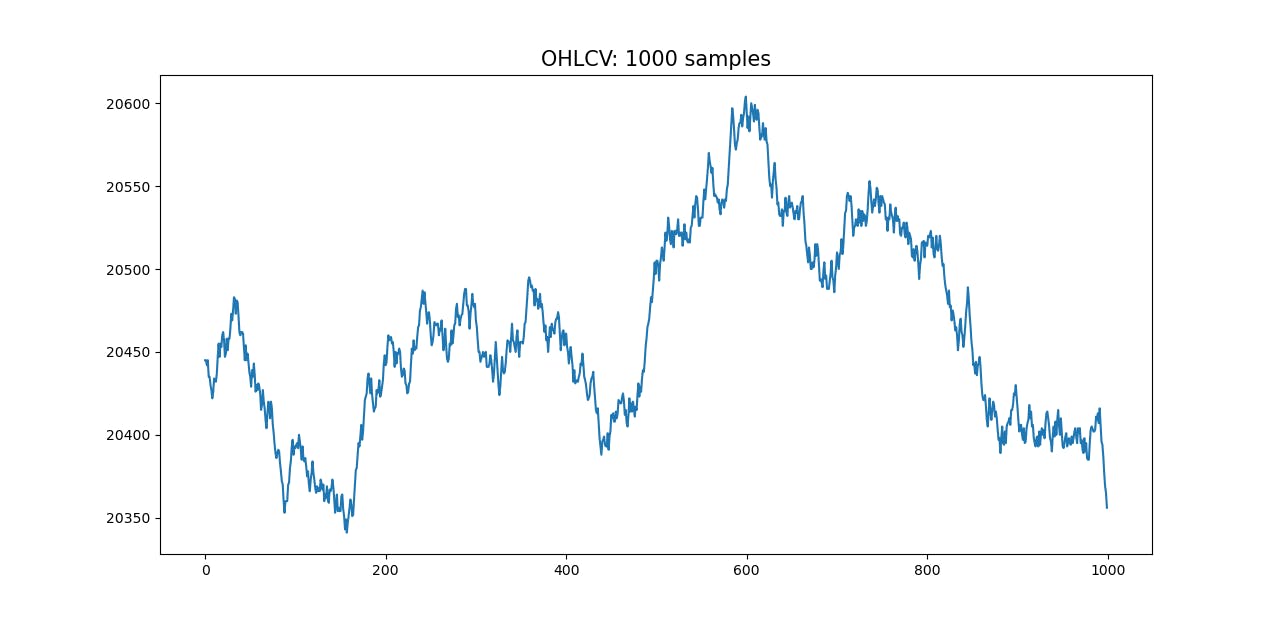
data = self.ohlcv.build(n = 1000)
self.ohlcv.plot(data)
return data
Now lets run the code and see what happens!
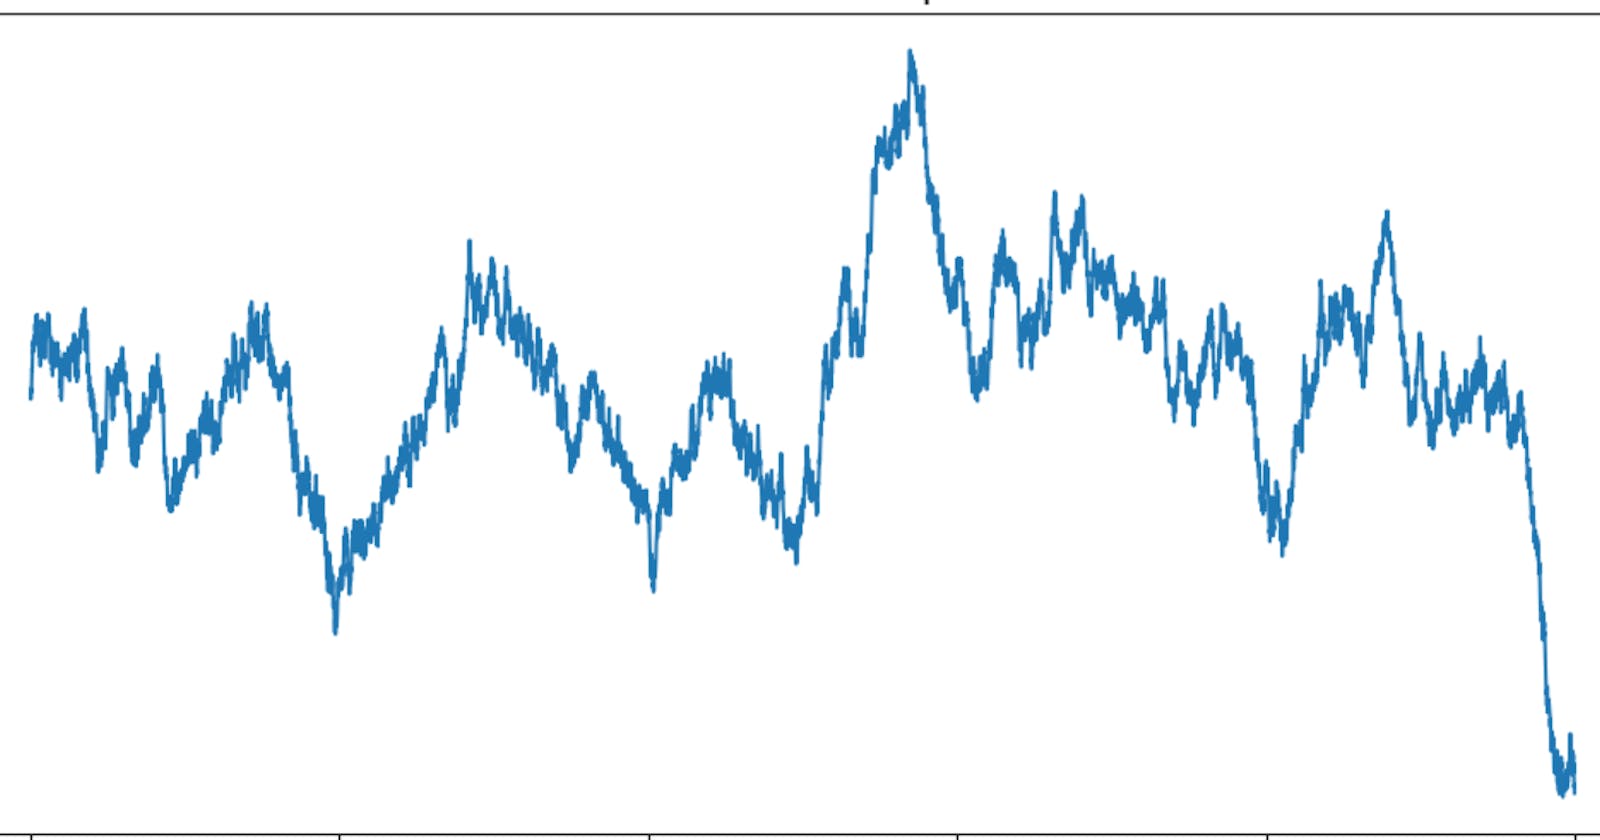
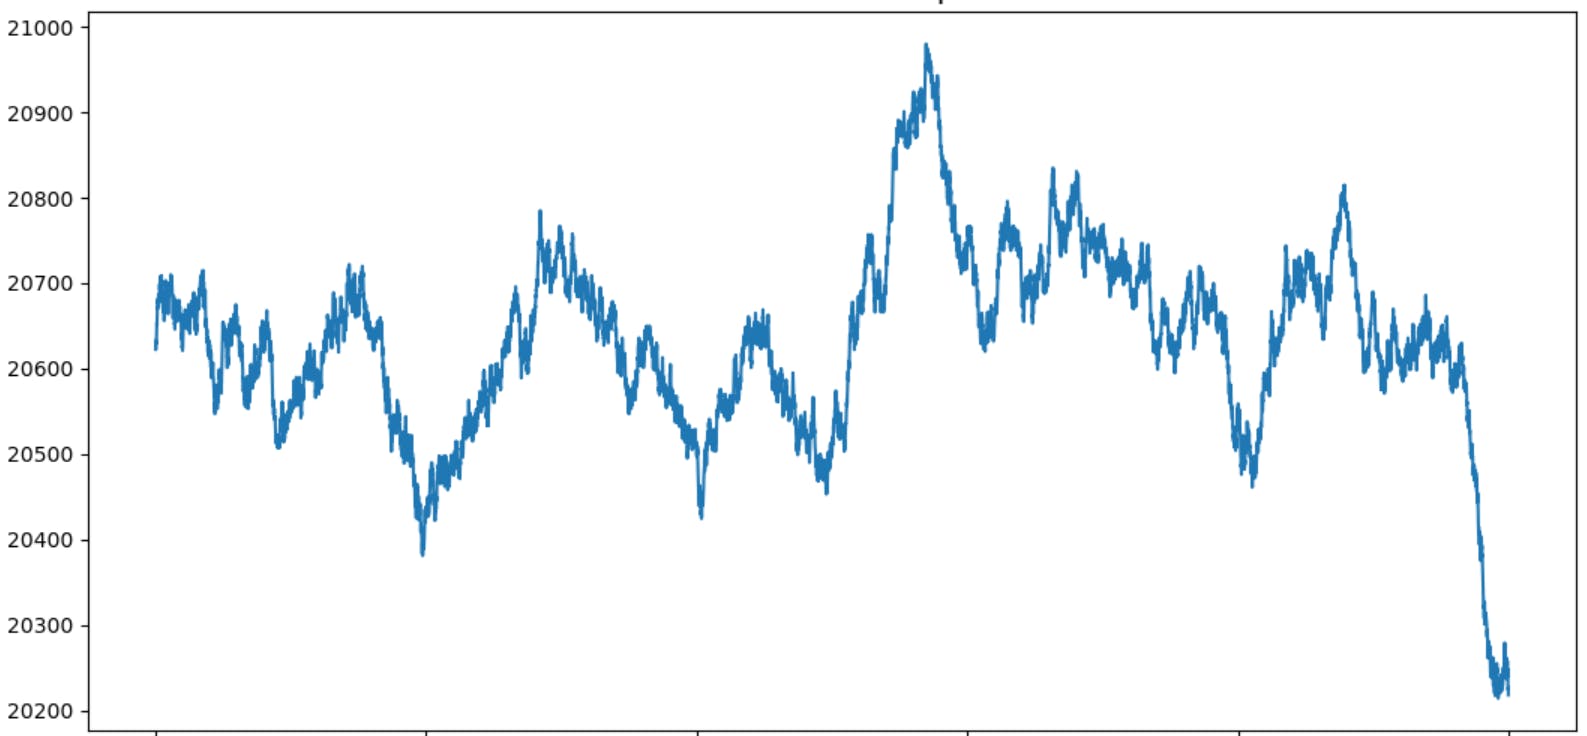
Generated OHLCV, 1k samples.
Generated tick data, 10k samples.
The code is available in my GitHub repo.
#python #marketdata #syntheticdata